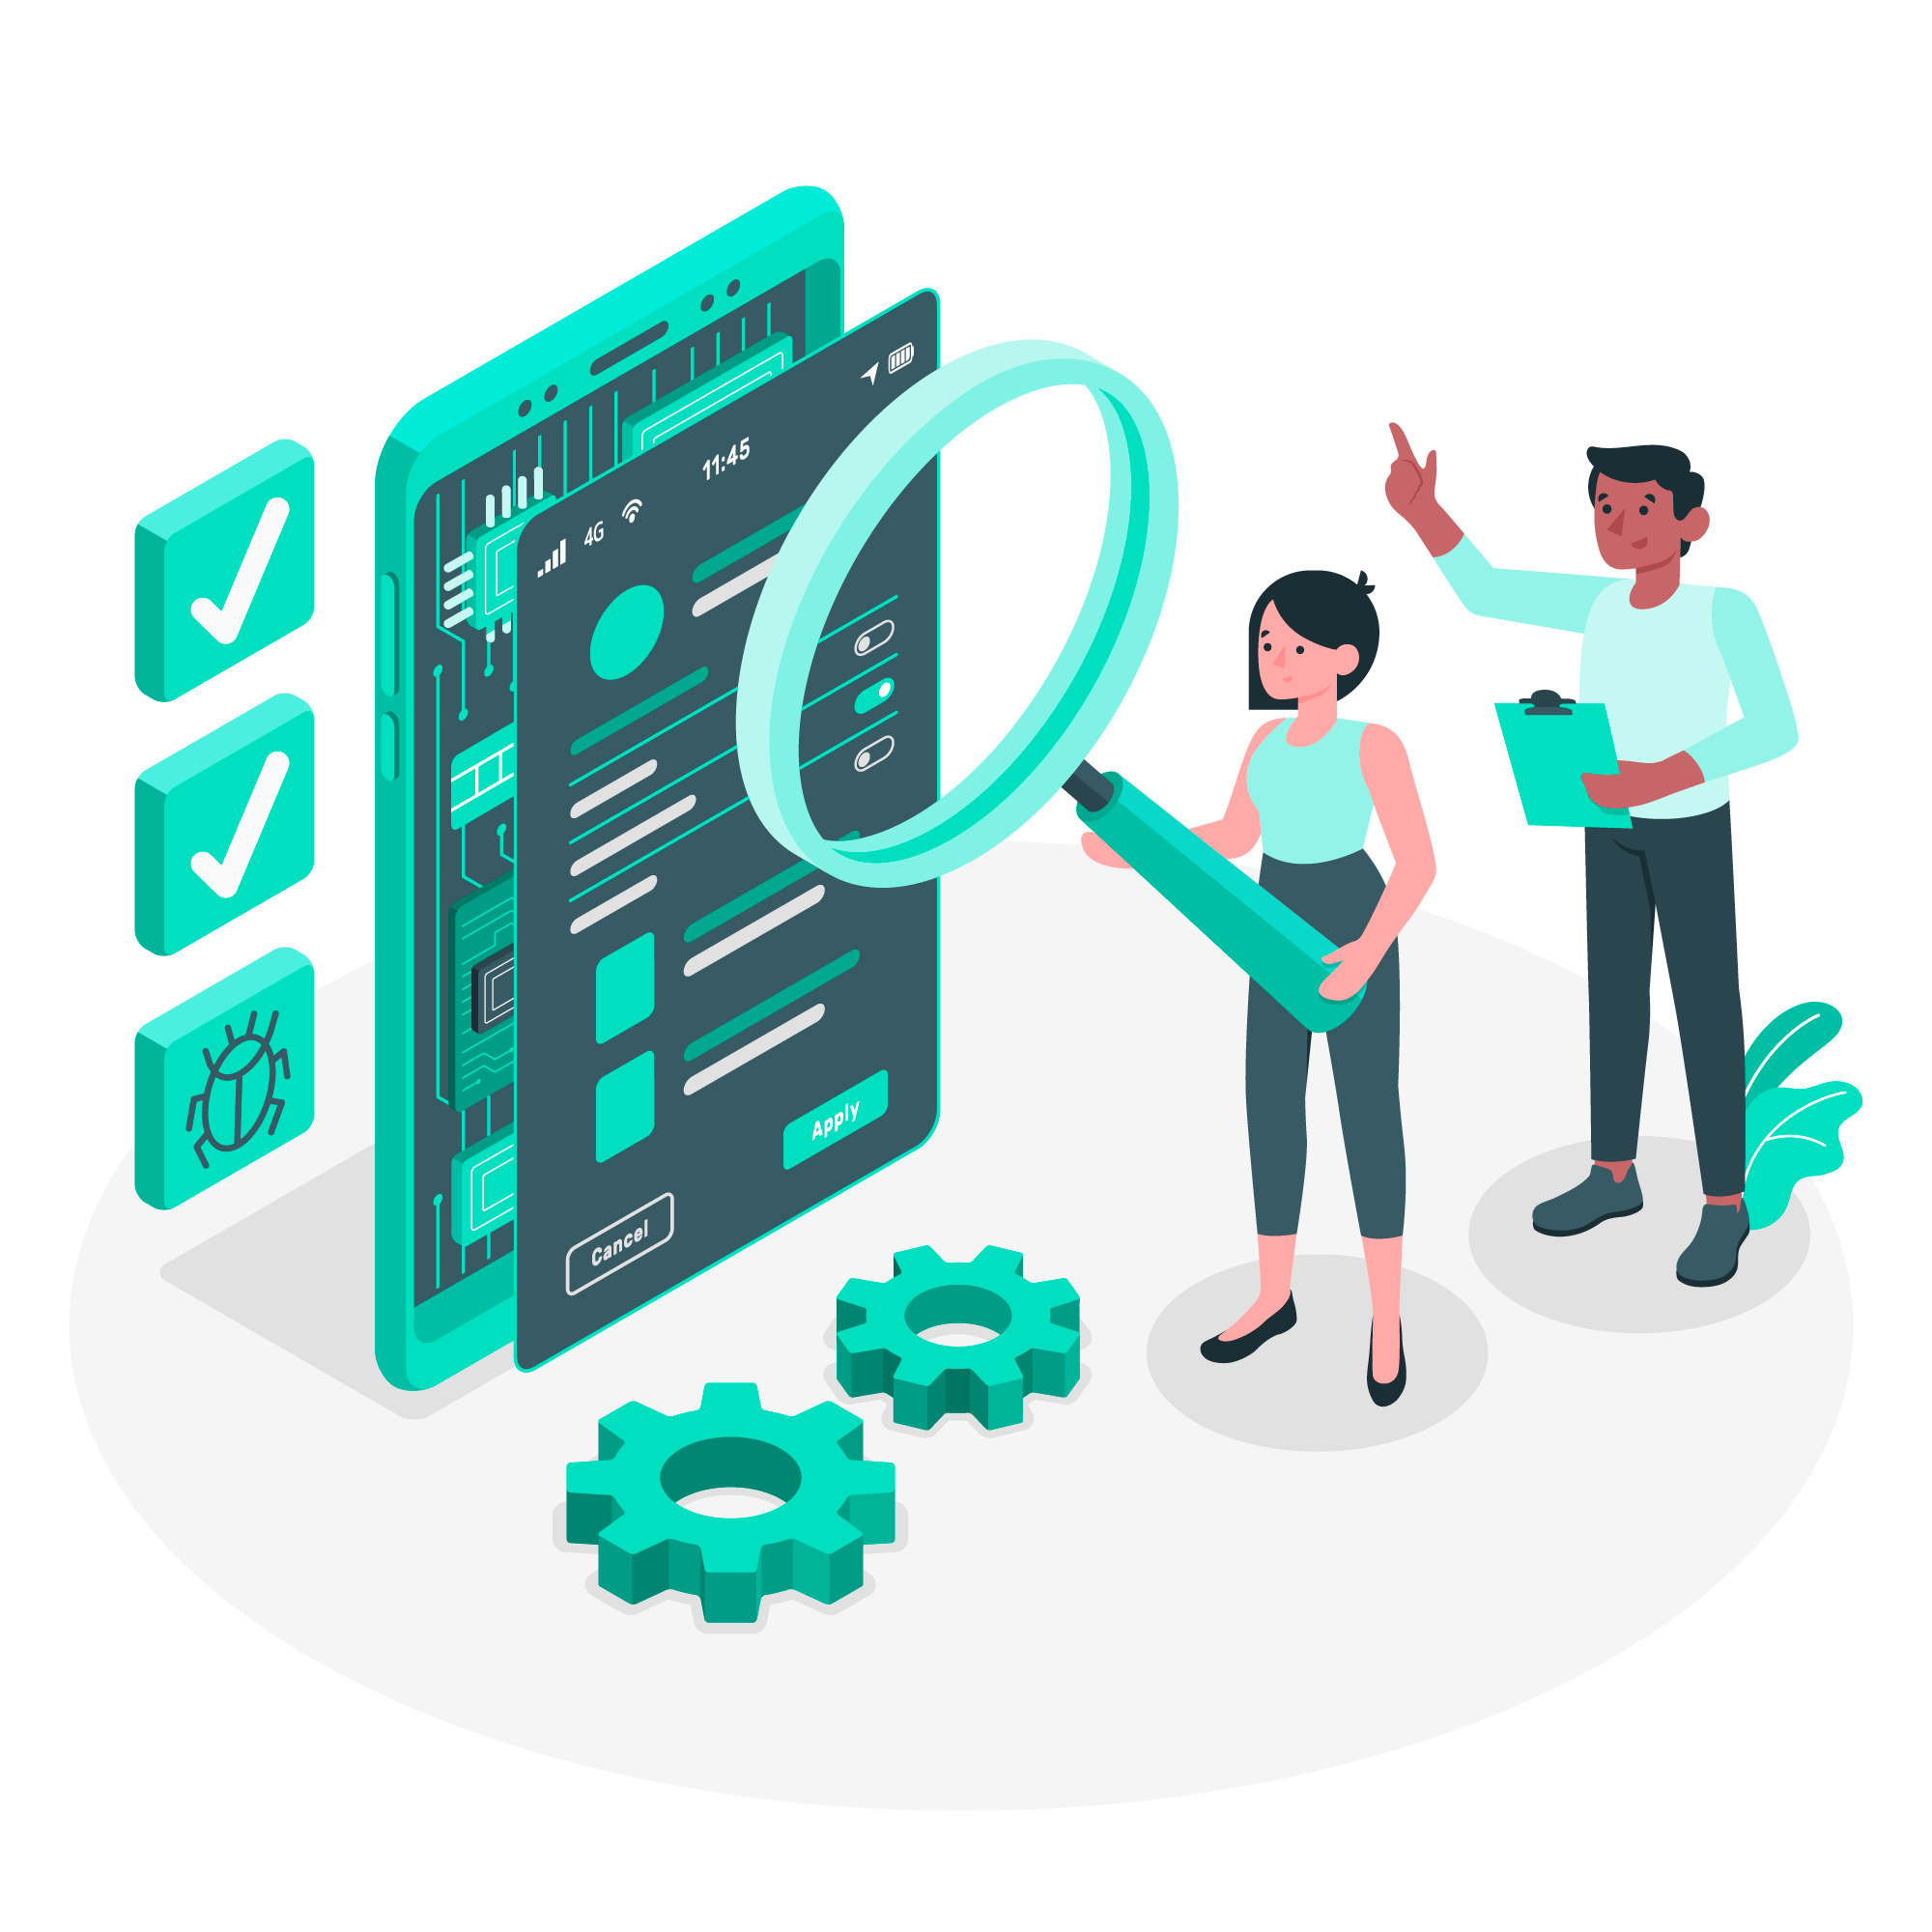
Application Diagnostics: An Insightful Surgical Approach
Subash S
Posted: Jul 6, 2023
The term “Surgical approach”, refers to a methodical, precise, and focused approach to problem-solving or decision-making. In the context of technical diagnostics or problem-solving, a surgical approach implies a systematic and targeted method of analysis and intervention to identify and address specific issues within software applications. By drawing parallels between medical diagnostics and application issue diagnosis, we gain insights into the systematic and methodical approach needed to identify and resolve problems in software applications.
The surgeon carefully examines a patient's symptoms, performs diagnostic tests, and then proceeds with precise surgical procedures to resolve the underlying problem. A surgical approach in software domains involves a similar level of precision and diligence. The emphasis is on thoroughly understanding the problem, breaking it down into smaller components, and addressing each component with precision and efficiency. It often involves a step-by-step process, careful analysis, and the application of appropriate tools or techniques to diagnose and resolve the issue at hand. This analogy helps us understand the importance of collecting data, analyzing symptoms, generating hypotheses, conducting tests, and providing appropriate treatments for the smooth functioning of applications. Application diagnostics mirrors a surgeon's precise examination of affected areas during a surgical procedure. Let's explore how application diagnostics can be narrated through a medical lens.
Symptoms and Observations:
Similar to a patient's symptoms, application issues manifest as observable problems, abnormalities, or unexpected behavior. These symptoms can include crashes, slow performance, error messages, or incorrect output. Just as a patient describes their symptoms to a doctor, users or stakeholders provide valuable information about the observed issues in the application.
Data Collection and Examination:
In medical diagnostics, doctors collect and examine various data, such as medical history, vital signs, laboratory tests, and imaging scans. Similarly, in application diagnostics, developers/Ops teams collect and analyze data related to the issue. This includes error logs, system logs, any recent changes or deployments, performance metrics, user feedback, and other relevant information that provides insights into the problem.
Analysis and Hypothesis Generation:
Medical professionals analyze collected data to generate hypotheses about the underlying causes of the symptoms. Similarly, software developers analyze the data collected during application diagnostics to generate hypotheses about the root causes of the observed issues. This involves examining log files, tracing code execution paths, and reviewing system behavior to identify potential causes. They could perform a thorough code review to identify any potential coding errors, logic flaws, or inefficiencies that could be contributing to the issue and pay attention to relevant sections of code that are closely tied to the observed symptoms. The goal here is to narrow down the possible causes and identify the most likely ones.
Testing and Validation:
Doctors perform tests and experiments to validate their hypotheses. Similarly, developers conduct tests and simulations to validate their hypotheses about the application issues. This can involve modifying the code, running test scenarios, or using diagnostic tools to further investigate and validate the hypotheses.
Diagnosis and Treatment:
Based on the validated hypotheses, medical professionals arrive at a diagnosis and recommend appropriate treatments. In application diagnostics, developers/ops teams identify the root cause of the issue and determine the necessary actions to resolve it. This may involve fixing code, adjusting configurations, or optimizing system components.
Documentation and Follow-up:
Just as medical professionals document the diagnostic process, developers document the steps taken during application diagnostics. This documentation serves as a reference for future troubleshooting and can help in similar cases. It also enables effective collaboration and knowledge sharing among the development/ops team.
Continuous Improvement:
Learn from the diagnostic process and implement measures to prevent similar issues in the future. This can include enhancing monitoring capabilities, improving error handling, optimizing system performance, and conducting regular diagnostics by running test cases(automated/manual) to proactively identify potential problems.
Handling issues that adversely impact business operations/end users:
Just like doctors prioritize cases based on severity, we do the same when handling issues. When a problem arises, we carefully evaluate its impact on users, systems, and business operations. By prioritizing the issue according to severity and potential impact, we determine the level of urgency. Make sure to convey the impact, current status, and urgency of the situation to the people involved, like the development team, DevOps team, and the management team. Implement temporary workarounds or fixes to mitigate the immediate impact of the issue while a permanent solution is being developed. The dedicated team involves individuals with diverse expertise, including developers, DevOps, and subject matter experts who collaborate to diagnose and try to resolve the issue effectively. Collaboration can bring fresh perspectives and help identify potential solutions. Getting everyone involved in the brainstorming process will ensure you get multiple perspectives when problem-solving.
Proactive monitoring and Alerting:
Proactive monitoring and alerting for our body are crucial for maintaining good health and preventing potential health issues. By actively monitoring our body's vital signs, symptoms, and overall well-being, we can detect any abnormalities or early signs of illness. This allows us to take prompt action, seek medical attention if necessary, and make informed decisions about our lifestyle and healthcare. Similar way, the application/infra monitoring tool is not just an extra feature, but something we need. When we monitor proactively and set up alerts based on specific limits, we can save time diagnosing problems, avoid errors from happening again, and catch issues before they become major. Delve into the realm of monitoring, where we keep a watchful eye on the health and performance of our applications. With the power of status codes embedded in our error logs, we can craft alerts that instantly respond to every application response, running test scenarios, or utilizing diagnostic tools to simulate and observe application behavior. The goal is to validate the identified issue and ensure that the proposed solution effectively resolves it.
Now, let's shift our attention and explore methods to improve our application diagnostic process;
Adopting Development/Operations Best Practices:
Surely, aiming for faster problem resolution by, as previously stated, the presence of a reliable monitoring and observability tool along with the development best practices can significantly reduce the time required for diagnosis. Let's examine the following scenarios as examples:
Error Logging:
To ensure proper error handling in our application, it is essential to utilize HTTP status codes effectively. There are a total of 63 officially defined HTTP status codes, ranging from 100 to 599. However, only 44 of these are commonly used. These status codes can be categorized into five classes:
Informational (1xx): Indicates that the request has been received and is being processed.
Successful (2xx): Indicates that the request was successfully received, understood, and accepted.
Redirection (3xx): Indicates that further action must be taken to complete the request.
Client Error (4xx): Indicates that the page is unavailable or the request was invalid or could not be fulfilled due to a client-side error.
Server Error (5xx): This indicates that the server encountered an error and could not fulfill the request.
By organizing monitoring dashboards based on these classes and setting up alerts, we can proactively identify and address issues before end users report them. Following application development best practices will significantly reduce the time required to diagnose application errors, whether they are caused by clients sending invalid requests or mistakes resulting from service throttling their requests.
Observability and Monitoring:
In our infrastructure, we have a diverse range of components that play crucial roles in running our applications. This includes servers that host the applications and databases responsible for storing application-related data. Additionally, we have various other components such as load balancers, autoscaling features, failover systems, message brokers, cron-based systems, and external APIs. Consider the scenario, when our application encounters a 502 error, our first course of action is to investigate the issue. We begin by examining the application server logs and, if necessary, debugging the application to gain a more comprehensive understanding of the problem. We also inspect the events of the application components to pinpoint the exact error. Eventually, we discover that the culprit behind the issue was the database connection throttling. It is important to note that this analysis process consumes a significant amount of time as we delve into the entire application flow. This is where the presence of a reliable monitoring and alerting system becomes invaluable.
Gathering and analyzing application performance monitoring API metrics, such as error rates, latency, and throughput, response time along with server hardware metrics like CPU, memory, and I/O traffic, as well as database performance metrics like disk space, read/write metrics, and connection count, is crucial. We should configure these metrics with various thresholds and set alerts with different severity levels. By doing so, we can stay proactive and well-prepared. For instance, if there is a sudden spike in database connections that surpasses a defined threshold, we receive an alert, enabling us to address the issue even before it impacts the application's performance.
Exception Handling:
Implement proper exception handling mechanisms to gracefully handle errors and prevent application crashes. Use meaningful error messages to facilitate effective problem diagnosis.
Testing and Quality Assurance:
Conduct thorough testing, including unit testing, integration testing, and end-to-end testing, to identify and address issues early in the development lifecycle. Implement automated testing frameworks for continuous integration and delivery.
Performance Optimization:
Optimize application performance through techniques like caching, database query optimization, and efficient resource utilization. Regularly analyze performance metrics and address bottlenecks to enhance overall application performance.
Security Measures:
Implement robust security practices, including secure coding practices, encryption, input validation, and vulnerability scanning. Regularly update dependencies and frameworks to address security vulnerabilities.
Conclusion:
By adopting an insightful surgical approach to application diagnostics, developers can streamline the problem-solving process, reduce downtime, and enhance the overall performance and reliability of software applications. They should carefully dissect the application's code, tracing execution paths and scrutinizing system behavior to identify potential causes of the issue. Once potential causes are identified, developers proceed with testing and validation to confirm their hypotheses. This may involve modifying the code. Furthermore, implementing the best development and operational practices helps streamline the diagnosis process.

 Application diagnostics mirrors a surgeon's precise examination of affected areas during a surgical procedure. Let's explore how application diagnostics can be narrated through a medical lens.